Category: Python Tools
Tags: collections, debug, python, Visual Studio, watch
Diving into the debugger again, we’re going to look at a very early feature that I had nothing to do with. Common to all programming languages (and at a deeper level, all computation) are data structures that contain other elements - “collections”. These may be arrays, lists, sets, mappings, or any other number of simple or complex types, each with their own preferred access method and characteristics.
What do I mean by “preferred access method”? In short, the most efficient manner to retrieve the element that you want. For example, arrays are best accessed using the element index, while (linked) lists prefer accessing elements adjacent to another. Sets are best used for mapping a value to true or false (as in, “does the set contain this element?”), and so on.
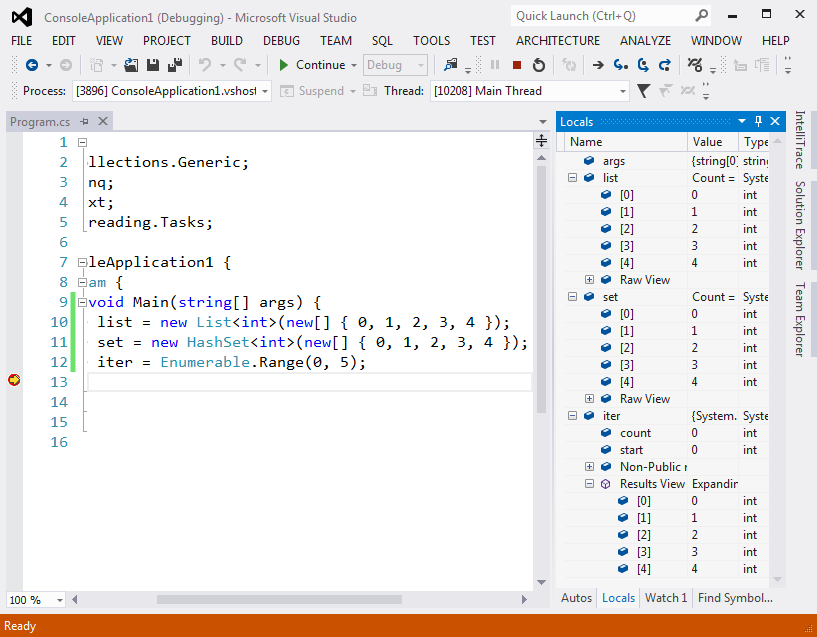
However, when it comes to debugging and introspection on a collection, the most useful access is complete enumeration. Retrieving every value in the collection and displaying it to the user allows many issues to be debugged that would otherwise be difficult or impossible. Those who are used to debugging in Visual Studio or another IDE will be familiar with the ability to view the contents of lists, sets and even list-like objects with no memory store (an Enumerable, in .NET):
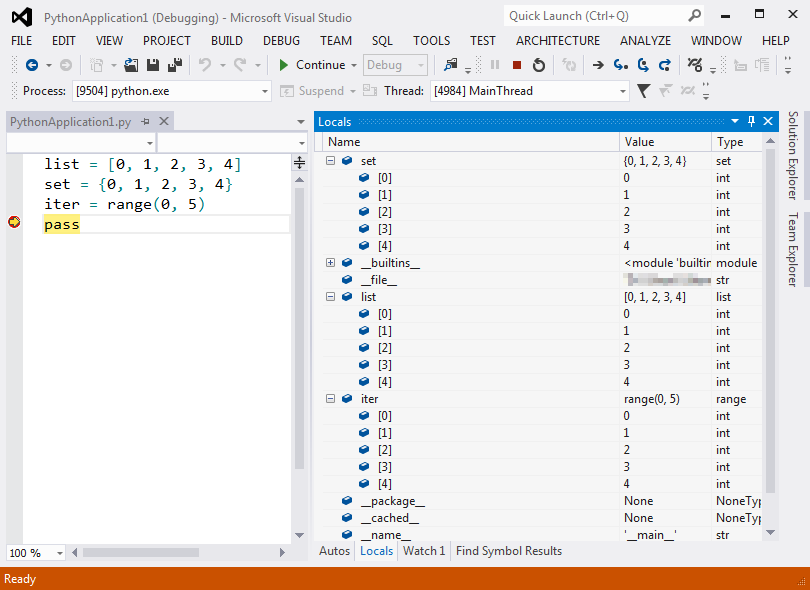
Like .NET, Python has a range of collection types, including some that can be infinitely large without actually being stored in memory. Being able to view the elements in these collections is essential when debugging, so much so that Python Tools for Visual Studio had support in its earliest public releases.
This post will look at the messages sent between the debugger and debuggee, how the collection contents are exposed to the user, and the approaches used to manage unusual collection types. The code is from changeset baff92317760, which is an early implementation and some changes have been made since.
Debugger Messages
As we saw in my earlier blog on User-unhandled Exceptions, there are a number of messages that may be sent between the debugger (which is a C# component running within Visual Studio) and the debuggee (a script running in a Python interpreter). The command sent is CHLD and it is handled in visualstudio_py_debugger.py like this:
self.command_table = {
    cmd('exit') : self.command_exit,
    cmd('stpi') : self.command_step_into,
    cmd('stpo') : self.command_step_out,
    cmd('stpv') : self.command_step_over,
    cmd('brkp') : self.command_set_breakpoint,
    cmd('brkc') : self.command_set_breakpoint_condition,
    cmd('brkr') : self.command_remove_breakpoint,
    cmd('brka') : self.command_break_all,
    cmd('resa') : self.command_resume_all,
    cmd('rest') : self.command_resume_thread,
    cmd('exec') : self.command_execute_code,
    cmd('chld') : self.command_enum_children,
    cmd('setl') : self.command_set_lineno,
    cmd('detc') : self.command_detach,
    cmd('clst') : self.command_clear_stepping,
    cmd('sexi') : self.command_set_exception_info,
    cmd('sehi') : self.command_set_exception_handler_info,
}
def command_enum_children(self):
    # execute given text in specified frame
    text = read_string(self.conn)
    tid = read_int(self.conn) # thread id
    fid = read_int(self.conn) # frame id
    eid = read_int(self.conn) # execution id
    child_is_enumerate = read_int(self.conn)

    thread = get_thread_from_id(tid)
    if thread is not None:
        cur_frame = thread.cur_frame
        for i in xrange(fid):
            cur_frame = cur_frame.f_back

        thread.enum_child_on_thread(text, cur_frame, eid, child_is_enumerate)
The two important parts to this handler are text and the enum_child_on_thread function. text is sent from the debugger and specifies the expression to obtain children for. This expression is compiled and evaluated in the context of the active call stack, which lets the user specify whatever they like in the Watch or Immediate windows, provided it is valid Python code.
We will look at enum_child_on_thread later, but it will eventually call report_children in order to send the results back to the debugger:
def report_children(execution_id, children, is_index, is_enumerate):
    children = [(index, safe_repr(result), safe_hex_repr(result), type(result), type(result).__name__) for index, result in children]

    send_lock.acquire()
    conn.send(CHLD)
    conn.send(struct.pack('i', execution_id))
    conn.send(struct.pack('i', len(children)))
    conn.send(struct.pack('i', is_index))
    conn.send(struct.pack('i', is_enumerate))
    for child_name, obj_repr, hex_repr, res_type, type_name in children:
        write_string(child_name)
        write_object(res_type, obj_repr, hex_repr, type_name)

    send_lock.release()
When the enumerated collection is sent back, it comes as a CHLD command again and in handled in PythonProcess.cs:
switch (CommandtoString(cmd_buffer)) {
    case "EXCP": HandleException(socket); break;
    case "BRKH": HandleBreakPointHit(socket); break;
    case "NEWT": HandleThreadCreate(socket); break;
    case "EXTT": HandleThreadExit(socket); break;
    case "MODL": HandleModuleLoad(socket); break;
    case "STPD": HandleStepDone(socket); break;
    case "EXIT": HandleProcessExit(socket); return;
    case "BRKS": HandleBreakPointSet(socket); break;
    case "BRKF": HandleBreakPointFailed(socket); break;
    case "LOAD": HandleProcessLoad(socket); break;
    case "THRF": HandleThreadFrameList(socket); break;
    case "EXCR": HandleExecutionResult(socket); break;
    case "EXCE": HandleExecutionException(socket); break;
    case "ASBR": HandleAsyncBreak(socket); break;
    case "SETL": HandleSetLineResult(socket); break;
    case "CHLD": HandleEnumChildren(socket); break;
    case "OUTP": HandleDebuggerOutput(socket); break;
    case "REQH": HandleRequestHandlers(socket); break;
    case "DETC": _process_Exited(this, EventArgs.Empty); break;
}
private void HandleEnumChildren(Socket socket) {
    int execId = socket.ReadInt();
    ChildrenInfo completion;

    lock (_pendingChildEnums) {
        completion = _pendingChildEnums[execId];
        _pendingChildEnums.Remove(execId);
    }

    int childCount = socket.ReadInt();
    bool childIsIndex = socket.ReadInt() == 1;
    bool childIsEnumerate = socket.ReadInt() == 1;
    PythonEvaluationResult[] res = new PythonEvaluationResult[childCount];
    for (int i = 0; i < res.Length; i++) {
        string expr = socket.ReadString();
        res[i] = ReadPythonObject(socket, completion.Text, expr, childIsIndex, childIsEnumerate, completion.Frame);
    }
    completion.Completion(res);
}
The _pendingChildEnums is part of the stateless communication infrastructure that allows the UI to remain responsive while the results are being collected. An array res is created to contain the result and pass it to the visualiser.
Displaying Children
Visual Studio provides a number of tool windows that display variable values. The one shown in the image at the top of this post is the Locals window, which displays variables in the active scope. There is also the Watch window, which lets the user enter any expression they live, the Parallel Watch window, which does the same thing across multiple threads, and the Autos window, which chooses relevant variables automatically.
For all of these views, the values that are displayed are implementations of the IDebugProperty2 interface: in PTVS, the implementation is in AD7Property.cs. (These are passed out to VS from various places in the debugger which we won’t be looking at right now.) The method that is most relevant here is IDebugProperty2.EnumChildren:
public int EnumChildren(enum_DEBUGPROP_INFO_FLAGS dwFields, uint dwRadix,
                        ref System.Guid guidFilter, enum_DBG_ATTRIB_FLAGS dwAttribFilter,
                        string pszNameFilter, uint dwTimeout, out IEnumDebugPropertyInfo2 ppEnum) {
    ppEnum = null;
    var children = _evalResult.GetChildren((int)dwTimeout);
    if (children != null) {
        DEBUG_PROPERTY_INFO[] properties = new DEBUG_PROPERTY_INFO[children.Length];
        for (int i = 0; i < children.Length; i++) {
            properties[i] = new AD7Property(_frame, children[i], true)
                .ConstructDebugPropertyInfo(dwRadix, dwFields);
        }
        ppEnum = new AD7PropertyEnum(properties);
        return VSConstants.S_OK;
    }
    return VSConstants.S_FALSE;
}
This method is called when the variable is expanded in VS. The call to _evalResult.GetChildren performs the communication described earlier, and will block until the list of the collection contents is available or the timeout expires. New AD7Property instances are created for each returned expression, allowing them to also be displayed in the variable windows. If they are expandable, they can in turn be expanded and have their elements displayed.
The other method of interest is IDebugProperty2.GetPropertyInfo, which returns a filled DEBUG_PROPERTY_INFO structure consisting mostly of displayable strings. (In fact, AD7Property only implements one method other than these two, which is SetValueAsString. IDebugProperty2 really does only serve a single purpose.) These strings are what are displayed in Visual Studio:
Looking into Collections
Now that we’ve seen how the debugger and debuggee communicate with each other, and how the debugger communicates with Visual Studio, let’s have a look at obtaining the values of the collections.
The actual work is performed in visualstudio_py_debugger.py in the enum_child_locally function. Obtaining the members is surprisingly simple, since the debugger is wrritten in Python and all supported collections have a consistent iteration interface:
if hasattr(res, 'items'):
    # dictionary-like object
    enum = res.items()
else:
    # indexable object
    enum = enumerate(res)
Dictionaries require special handling, since normal enumeration only includes keys and not values, but all other iterable objects can be passed directly to enumerate. Both cases of the snippet shown result in enum containing a sequence of key-value tuples, where the key for non-dictionary collections is the 0-based index. The section of code following this converts the sequence to a list.
A large amount of exception handling exists to safely handle ‘bad’ objects. Any developer can implement their own __iter__(), __next__() (nee next()) or items() methods, potentially causing issues in our code. When an exception is thrown, we either skip that element (which also skips that index) or simply abandon enumeration completely. However, there are two types of ‘collections’ that need special handling.
The first are infinite iterators, which are a “list-like object with no memory store” like we saw earlier. When one of these is encountered, there is no way to discover it in advance. A timeout is used to prevent Visual Studio from waiting forever. However, because of the stateless nature of the debugger/debuggee communication, even though VS has decided it is no longer interested, the Python code will continue creating an infinitely long list of objects to return (until a MemoryError is raised, and then the list and the strings are deallocated and it’s as if nothing ever happened).
A relatively simple fix is used here: the number of elements returned is capped at 10,000. Because it is completely unwieldly to view 10,000 elements in the variable windows, most users will never encounter this limit. At the same time, fewer users are unlikely to see iterables displaying no elements, and infinite iteration errors are often identifiable from a short subsequence that would otherwise not be displayed. So while it looks like a hack, the end result is a better experience. (And you can view any element you like by adding '[<index>]' after the name in the Watch window, even well beyond the 10,000 element limit.)
The other ‘collection’ that receives special handling are objects themselves. You have probably noticed throughout the code samples and SDK documentation that the “expandable” objects contain “children”. This functionality is not just used for collections, but also to allow objects to expand and list their members. If all the code above fails with an exception (which will typically be TypeError when attempting to iterate a non-iterable object), the following code runs:
# non-indexable object, return attribute names, filter callables
items = []
for name in dir(res):
    if not (name.startswith('__') and name.endswith('__')):
        try:
            item = getattr(res, name)
            if not hasattr(item, '__call__'):
                items.append( (name, item) )
        except:
            # skip this item if we can't display it...
            pass
This uses Python’s dir function to obtain a list of all the members of the object, filters out private (__special_name__) members and callable methods, and returns the rest in a similar fashion to the members of a dictionary.
Summary
Debugger support for enumerating collections allows Python Tools for Visual Studio to display members of collections in the user’s code. Visual Studio provides the user interface for the functionality, requiring only minimal implementation on the part of the language-specific debugger. As well as collections, PTVS (and other VS languages) use this to expand regular objects and display their member variables. This feature was part of the very first releases of PTVS.